I posted about these some years ago, but there is now a range of new visualisations available.
Visit the site and every few seconds you are treated to a new one...


A blog providing ideas and resources for those teachers hoping to teach the new GCSE Specification, first announced in April 2022. Draft subject content released for consultation in June 2026 - for first teaching from 2028 or 2029.
I posted about these some years ago, but there is now a range of new visualisations available.
Visit the site and every few seconds you are treated to a new one...
Thanks to Hannah Steel for the link to this useful visualisation tool.
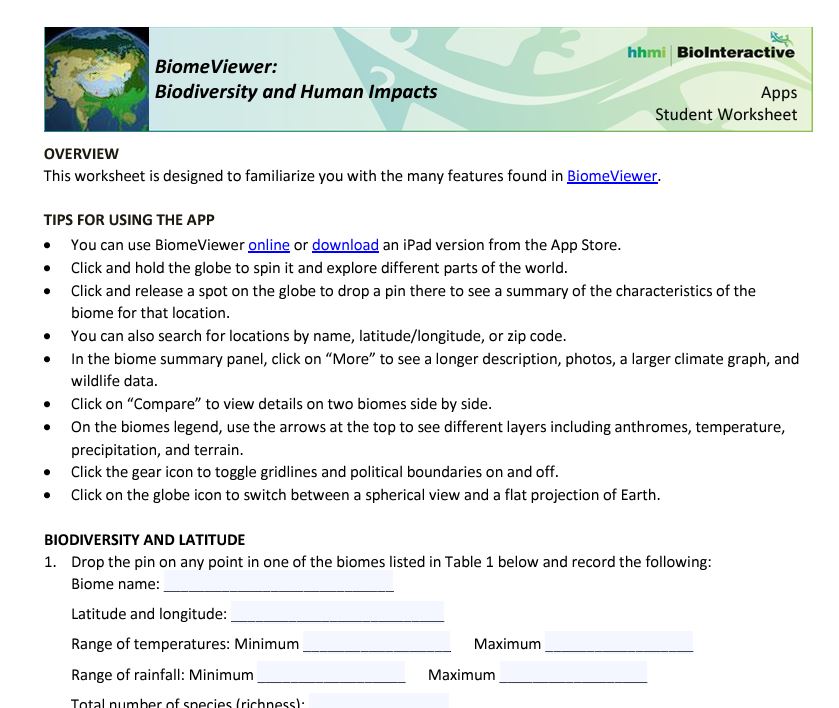
Biomeviewer displays a range of information in a visual way.

It's really useful for identifying biomes in a general way, and rotating the globe to see where they are located and identifying their characteristics.
There are accompanying resources in a folder, student worksheet and apparently an iOS app too.
The worksheet takes students through the various features which are built into the app.
You can also explore anthromes: anthropogenic biomes. These are where the majority of humanity lives.
A classification proposed by E.C. Ellis, October 25, 2005 lists them. Minimum mapping scale greater than or equal to one square kilometer.
My hope would be that the new specification will involve an expectation of a deal of mapwork using the Ordnance Survey's mapping, plus ESRI GIS mapping and Survey123 for the collection and visualisation of fieldwork data. They may also need to use the MAGIC map, maps of National Landscapes etc and ensure that location and description of context is an important part when considering the range of habitats and how the landscape and Natural History of the UK has changed over the centuries.
I've been involved with the OS in numerous ways over the years: as a GetOutside Champion, author of support resources for Digimap for Schools and Digimap for Colleges / Mapstream. Also as an author of articles for Mapping News and other support for various campaigns and activities.
Happy Friday! We're liking this playful new identity for the National Education Nature Park that captures the essence of nature and education. 📘🌳https://t.co/1wsoDx71av
— MeeCreative (@Mee_Creative) November 3, 2023
Out of Place Studio worked on the new identity.
I really like the graphics and the overall look of the communications forming part of the development of the materials.

Exploring the development of the world's continents and its changing tectonic history is part of the suggested specification.
Check out the map here.Discover when you home was last under the sea with this interactive globe of the Earth's changing sea levels over the last 135,000 years.https://t.co/xfV3bnurdx pic.twitter.com/1O1BC0ew1U
— gmapsmania mapstodon.space/@mapsmania (@gmapsmania) November 2, 2023


This is an interesting area of the proposed specification. I will be interested to see whether this remains in the final document as it is quite a different period of natural history - when certain species emerged for the first time according to evidence in the fossil record.
A new update in the list of visualisations which students should be introduced to. I've previously posted about the Biodiversity Stripes.
The Forest Stripes show the decline in forest species.
Been working on a tree report 💚 V lucky to have worked with team Stripes on a beautiful illustration for it. When we lose forests, we lose forest wildlife & the natural forest systems 1.6 Billion people depend on. https://t.co/iRO1IgHl3Z 🌳💚 ➡️https://t.co/4jkbLdtwOS https://t.co/B4TR2fAYBj
— Mary Gagen (@maryhgagen) October 24, 2023

A cross posting from my Geo Library blog project - what do you mean you haven't visited? There's over 700 books that would be of in...


